Nutrinomist — the multilingual platform for holistic professionals working online
Biomarkers

Drop in a lab PDF. Get structured results.

AI reads lab reports in any language, converts the values to SI units and checks each one against a standard and an optimal range, with a chart of every marker over time.

  • 130+ common markers recognised by name
  • Reports in any language, marker names in yours
  • Nothing is saved until you approve it
Included from the Pro plan
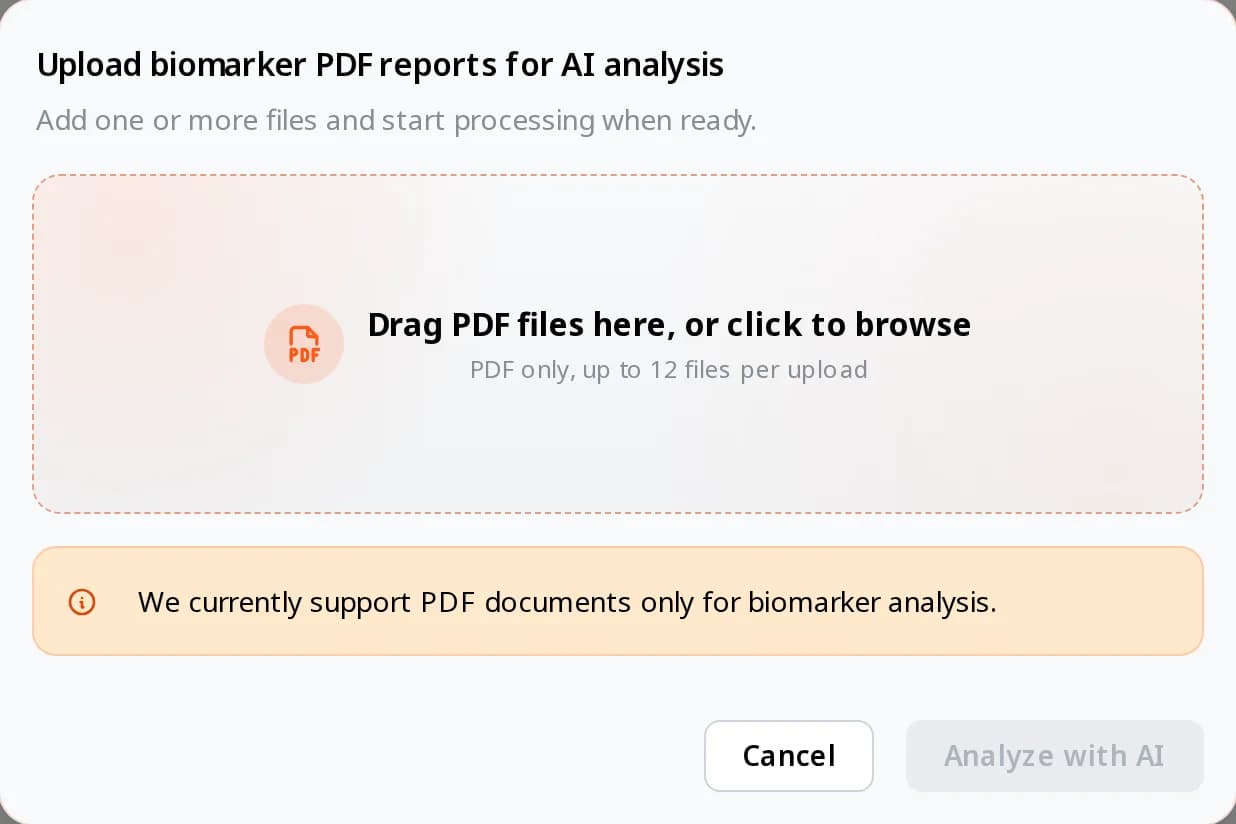
The biomarker import window: drag PDF lab reports here, up to 12 files per upload, then Analyze with AI
Use case

A new client arrives with three years of lab reports

A new client books a first session and emails five PDFs from two labs, one of them in German. Ferritin and vitamin D have been low on and off, and you want to see how they moved before you meet.

Today

You open each PDF, translate the German one and type the values into a spreadsheet, converting units where the labs differ. An hour later you have a table, and no way to tell whether you mistyped a decimal.

With Nutrinomist

You drop the five PDFs into the client's Biomarkers tab and keep working while they are read. When the import is ready you check the values, approve them, and open ferritin to see three years on one chart.

What it does

Everything biomarkers do, in detail

From the lab PDF to a chart of every marker. Biomarkers are included from the Pro plan.

Import a stack of lab reports at once

Drag a client's PDF lab reports into their Biomarkers tab, up to 12 files in one go, from any lab and in any layout. The analysis runs in the background: minimize the window and carry on, and a note tells you when an import is ready to review.

What it saves you: Retyping values from PDFs.

  • PDF lab reports, up to 12 per upload
  • Any lab and any layout
  • Runs in the background while you work
  • A note tells you when it is ready to review

Read in any language, filed in yours

AI reads each report, translating it first when it is in another language. For every marker it picks up the value, the unit, the date the sample was taken, the lab's reference range and any note from the lab. Names are matched to more than 130 common markers, whatever the lab calls them, and values are converted to SI units so results from different labs line up.

What it saves you: Translating reports and converting units by hand.

  • Reports in other languages are translated first
  • Value, unit, sample date, reference range and lab note
  • Lab names matched to 130+ common markers
  • Values converted to SI units
  • Marker names shown in your language

You check everything before it is saved

Extracted values wait for you in a review list. Correct a value, remove an entry you don't need, then approve the import or reject it. Nothing reaches the client's record until you approve it.

What it saves you: Wrong numbers slipping into a client's history.

  • Correct any extracted value
  • Remove entries you don't need
  • Approve or reject the whole import
  • Nothing is saved until you approve

A standard and an optimal range for every marker

Each marker carries two ranges. The standard range comes from the reference range on the lab's report, and the optimal range starts inside it. Adjust both whenever your practice works to different numbers. Every value is then marked optimal, standard or out of range.

What it saves you: Checking every value against a reference sheet.

  • Standard range from the lab's report
  • An optimal range you can adjust
  • Each value marked optimal, standard or out of range
  • Both ranges shaded on the chart

Every marker over time

Each import adds to the client's history. Open a marker to see all its readings on one chart, with the latest value, the change since the first reading and the number of records. Click a reading to see how far it moved from the one before.

What it saves you: Laying old reports side by side to spot a trend.

  • One chart per marker, with every reading on it
  • The latest value and the overall change
  • Click a reading to compare it with the previous one
  • Notes on each marker, saved as you type

Add and correct results by hand

Not every result arrives as a PDF. Add a marker with its unit, add a reading for any date and time, edit values, rename a marker, change its unit or delete a single reading.

What it saves you: A separate spreadsheet for results that came on paper.

  • Add a marker and its unit
  • Add a reading for any date and time
  • Edit values, rename a marker or change its unit
  • Delete a single reading

How it works

1

Upload the lab PDFs

Any lab and any layout, up to 12 files at a time.

2

AI reads and converts

Reports are translated where needed, marker names matched and values converted to SI units.

3

Review and approve

Correct or remove anything, then approve. Nothing is saved before that.

4

Track over time

Results join the client's biomarker history, with a chart, both ranges and your notes.

Frequently asked questions

What lab reports can I import?

PDF lab reports with text in them, the kind labs send by email, from any lab and in any language. A scan or photo of a paper report isn't read yet: add those results by hand. You always review the values before they are saved.

Can I set my own reference ranges?

Yes. Every marker has a standard range, taken from the lab's report, and an optimal range. Adjust either one, and the chart and the value status follow your numbers.

Which plan includes biomarkers?

Biomarkers are included from the Pro plan. If you later move to a plan without them, the results you imported stay readable; importing and adding new markers stop.

Works even better together

Every Nutrinomist feature is built to hand work to the next one.

Let AI do the retyping

Start free, and move to Pro when you want your clients' lab reports read for you.