From Pro
A new panel each quarter, added to the same charts
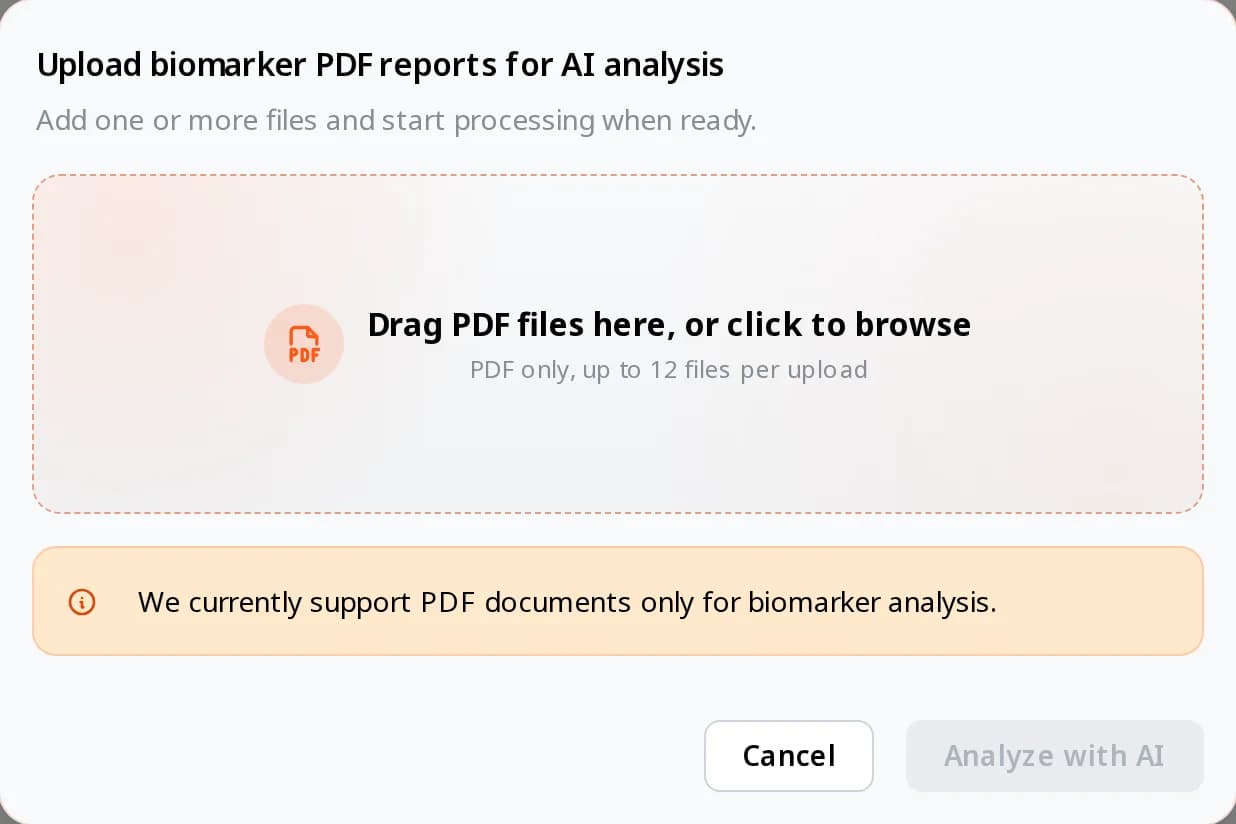
Every quarter the client sends their new panel. You import it into their Biomarkers tab, check the values and approve them. Each marker's chart gains a reading, with the latest value, the change since the first reading and both ranges shaded, and you keep a note on each marker as you go.
What it changes: The review starts from the chart instead of a spreadsheet, and the record keeps building year after year.
- PDF reports from any lab, in any language; scans added by hand
- Click a reading to compare it with the one before
- A reading added by hand when a result came on paper